In February/March 2025, the Commission’s harmonised business and consumer surveys included additional ‘ad hoc’ questions investigating 1) the extent to which European firms adjust their business strategies in response to tensions, disruptions or policy changes in foreign markets, and 2) the impact of selected factors on consumers’ views of their country’s economic situation. (35) This Special Topic summarises the results of the two ad hoc surveys.
European firms’ strategic response to tensions, disruptions and policy changes in foreign markets
Increasing geopolitical tensions and trade fragmentation challenge the resilience of global value chains, by undermining the collaborative networks on which they depend. As countries impose trade restrictions or become less dependable partners, companies may reconfigure their supply chains, redirect output to new markets, or relocate production or operational hubs to more stable or 'friendly' countries. The set of four ad hoc questions included in the February/March waves of the business surveys investigated these adaptive strategies and their potential impacts on operational costs and output prices. The results of this ad hoc survey must be interpreted against the backdrop of mounting challenges to the global trade environment posed by the recent turn towards protectionism in the US. While the questions were asked before the announcements of new US tariffs on goods imports from the EU, the new US administration had already clearly signalled its sharp protectionist shift.
Twelve EU Member States, representing 63% of EU GDP took part in the ad hoc survey, though not always covering all four sectors. In the EU, more than 44 000 firms took the ad hoc survey. Of these, firms in the manufacturing and services sectors accounted for around 30% each; construction and retail trade made up another 20% each of the sample. To derive EU and cross-sector country estimates, the results were aggregated using weights based on gross value added in each country and sector. All figures reported in this text are weighted averages.
The questions read as follows:
Q1. Have you adjusted, or plan to adjust, your strategies regarding the sourcing of inputs, location of production, or destination markets in recent years, in response to tensions, disruptions or policy changes in your foreign markets?
- - yes, we have adjusted our strategies;
- - yes, we plan to adjust our strategies;
- - no, we have not adjusted our strategies and don’t plan to do so;
- - not applicable, fully domestic business.
Firms that responded to this question with either "yes, we have adjusted our strategies" or "yes, we plan to adjust our strategies" were subsequently asked the following questions:
Q2. The adjustments are or will be of the following nature (multiple answers possible)?
- - increasing stocks to serve as buffers in the face of unexpected disruptions;
- - changing the countries from which you source inputs/goods or to which output is destined;
- - relocation of production/operation back to your country (reshoring);
- - relocation of production/operation to other countries (friendshoring).
- - other.
Q3. What is or would be the effect on your production costs or operational costs?
- - an increase;
- - no impact;
- - a decrease.
Q4. What is or would be the effect on your final prices charged to consumers/customers?
- - an increase;
- - no impact;
- - a decrease.
| Graph II.2.1: Intention to adjust strategy, by sector |
 |
A large share of EU firms is exposed to foreign markets, most of them in the manufacturing sector. Roughly 40% of all enterprises identified themselves as fully domestic businesses (see Graph II.2.1). As to be expected, this share was lowest in manufacturing (11%), implying that this sector is most exposed to foreign markets and involved in global value chains. EU construction, services and retail trade all recorded a share of just below or above 50%. Of the 60% of firms with external trade ties, slightly more than half replied that they had not adjusted and were not planning to adjust in response to tensions, disruptions or policy changes in foreign markets. This left around 27% of firms either reporting to have already adjusted their strategies (19%) or planning to do so (8%). Again, industry stands out, as the majority of adjusting firms operate in this sector (55%), followed by services (20%) and retail trade (17%). Firms in the construction sector with international trade ties and adjusting are relatively few (8%).
Changing trade partner was the most likely response to tensions, disruptions or policy changes in a firm’s foreign markets. Among EU firms that adapted or planned to adapt their strategies, the measure most often cited is ‘changing the countries from which we source inputs/goods or to which output is destined’ (38%). In industry, this strategy was reported by almost 46% of firms.
| Graph II.2.2: The adjustments are or will be of the following nature, per sector |
 |
Firms also raised their inventories, likely to improve resilience. For 22% of all adjusting firms, and 27% of adjusting firms in industry, the adaptations consisted of ‘increasing stocks to serve as buffers in the face of unexpected disruptions’. In the post-pandemic period, keeping higher stocks may be more than just a temporary response to a specific disruption. There is growing evidence that firms are maintaining higher buffer stocks of critical inputs and finished goods to reduce exposure to single-source or foreign suppliers and to hedge against price volatility. This is observed especially in intermediate goods and capital goods sectors, semiconductors, and pharmaceuticals. Empirical studies also show a statistical link between trade policy uncertainty and higher inventory holdings, especially in global value chain-intensive industries. (36)
“Other” adjustments were reported most prominently in the services sector. Across sectors, a relatively high share of firms (36%) reported “other” adjustments. Additional strategies identified in the literature include vertical integration, digitisation, and enhanced supply chain monitoring. The European Investment Bank's survey on supply chains provides evidence of these strategies. (37) Within sectors, nearly a quarter of manufacturing firms reported adopting alternative measures, while the services sector reported the highest share, at over 45%. This may relate to the sector's specific methods for adapting to changes in the trade environment, such as service modularisation and increased investment in compliance and risk monitoring to effectively navigate regulatory shifts
Among the firms considering to re-locate their production or operations, most consider relocating to another country rather than back to their country. Offshoring firms and multinational enterprises may also find it necessary or advantageous to relocate their production or operations to other countries or bring them back to their home country. Of the 21% firms that chose to relocate, a large majority — almost two thirds — considered relocating to other countries (friendshoring) rather than moving operations/production back to their country (reshoring)’. In industry, almost one fifth considered relocating their production hubs, of which four fifths preferring to move to another country rather than re-shoring. Moreover, a higher share of firms in services reported a preference for reshoring activities than in industry.
More firms expect incurred costs and prices charged to increase than to decrease. (38) Around 38% of the adjusting firms expect the changes in their trade strategies to lead to an increase in their production or operational costs, while 17% anticipate a decrease. The distribution of these responses is similar across the industry, services, and construction sectors, whereas nearly half of retailers expect an increase in operational costs. Regarding the effect on prices charged to customers or consumers, a majority of adjusting firms (57%) at total sector level expected prices not to change as a consequence of changing strategies, while close to a third expected prices to increase. Very few firms (4%) expected prices to decrease. A slightly smaller share of firms in industry expected prices to increase.
| Graph II.2.3: Effect on production and final prices |
 |
The results indicate that firms will not necessarily pass on higher costs to prices but increase profit margins if costs become lower because of changing strategies. More firms expect costs to increase (38%) than prices to increase (31%). This is true at sectoral level as well. Conversely, the share of firms expecting prices to decrease (4%) is lower than the share expecting costs to decrease (17%). In the absence of microdata allowing to match firms’ replies to the two questions, these results can only be tentatively suggestive of some degree of profit squeeze when costs increase and pricing power by firms when costs decrease.
The impact of selected factors on consumers’ views of the economy
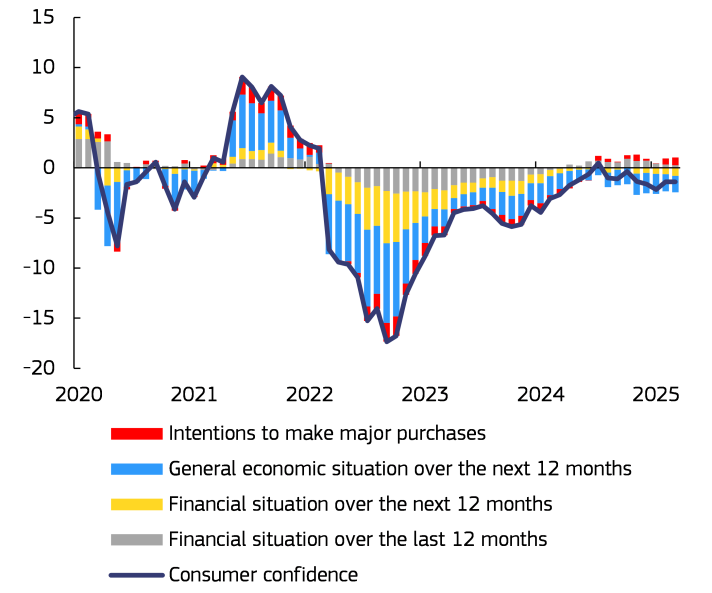
Consumers' views on their country’s economic situation are a key driver of consumer sentiment (39), particularly in economic downturns or times of economic uncertainty. The Commission’s consumer survey enquires about consumers’ assessments of the economic situation in their country – both in the 12 months preceding and following the survey.
| Graph II.2.4: EU estimate (*) - Consumer confidence and component contributions (mean adjusted) |
 |
| (*) see footnote 39 |
After collapsing in the aftermath of the pandemic shock and quickly rebounding thereafter, consumers’ views on the general economic situation plummeted again in autumn 2022, as inflation peaked at two-digit levels. They have partially recovered since then but remain below their respective long-term averages and significantly lower than their pre-COVID-19 levels. Since summer 2024 they have been worsening again. As one of the four variables making up the Commission’s consumer confidence indicator, consumers’ expectations about their country’s economic situation is the component contributing most to the changing moods of consumers since 2020 – and consistently dragging consumer confidence down since early 2022 (Graph II.2.4).
| Table II.2.1: Factors and examples provided to respondents. |
 |
An ad hoc question in the European Commission’s consumer survey explores the impact of selected factors on consumers’ views on their country’s economic situation. The question was formulated as follows: "Over the past 12 months, how have the following factors influenced your views about the economy of your country?”. Table II.2.1 displays the factors that were presented to consumers. For each factor, respondents could select one of four answer options: ‘Positive impact’, ‘Negative impact’, ‘No impact’, or ‘Don't know’. To enhance clarity, examples were provided for each factor. Thirteen EU countries, accounting for 52% of the EU population, participated in the ad hoc survey. The results presented in this Special Topic (40) must be interpreted in the context of the increasingly complex and unpredictable economic and geopolitical landscape facing the EU economy. At the same time, falling inflation, a resilient labour market, and more favourable financing conditions for households and firms laid the foundation for a gradual recovery in consumption in the EU.
| Graph II.2.5: EU estimate results |
 |
| Factors are ranked by share of 'negative impact' (weighted) views (from highest to lowest). |
Most factors were assessed as negatively impacting the economy, with the cost of living remaining the most widespread concern (see Graph II.2.5). Although inflation in the EU in March 2025 was back to 2.4%, over three-quarters of respondents still reported inflation and the cost of living to negatively impact the economy of their country. This feature was shared across all participating countries and likely reflects the legacy of the recent inflationary surge, which significantly eroded the purchasing power of consumers and left prices for essential goods and services significantly higher. Other factors viewed negatively by most respondents and in most countries included global developments and trade policies, domestic political developments, climate change and public policy (i.e. changes in taxes and public spending). ([3])
The results for the labour market and interest rate developments are more mixed across countries. In a context of resilient labour markets and easing, but still relatively high, interest rates, the picture is more mixed when examining how the labour market situation and interest rate developments are reported to impact the economic situation. In six countries, the labour market was largely perceived as a negative factor for the economy, while interest rate developments were predominantly viewed negatively in five countries.
Technological change was the only factor for which positive views prevailed over negative ones. As many as 37.8% of respondents reported technological change as a positive factor for the general economic situation, against less than a quarter viewing it negatively and another quarter considering they have no impact on their assessment.
| Graph II.1.6: Impact of the different factors by age group - percentage balance ([4]) |
 |
The age of interviewees significantly influenced their responses. Younger individuals (18-29 years) tend to be more optimistic, or less pessimistic, about the impact of all factors, and in particular technological change, global developments, and – perhaps unexpectedly - climate change (see Graph II.1.6). While a majority of both older and younger respondents considered inflation as an important negative factor, older respondents do so more often than younger ones.
Other socio-demographic characteristics play a role. The unemployed, lower income groups and older individuals tend to refer to both labour market (see Graphs II.1.6 and II.1.7) and interest rate developments as negatively affecting their views on the overall economy, whereas people in employment, with higher incomes and/or higher education and young individuals are more likely to view these two factors as positive. Higher income and education groups, as well as employed individuals are also likely to view technological changes as having a (more) positive impact on the economy, whereas the lowest income groups and the unemployed view them dominantly negatively (see Graph II.1.8). Strikingly, concerns about Inflation/cost of living rank high in consumers’ concerns across socio-demographic groups, i.e. across income quartiles, employment status groups and sex. Finally, respondents with lower income, lower education, and the unemployed tend to exhibit a higher share of ‘don't know’ responses.
| Graph II.1.7: Factor "labour market" - percentage balance (42) | Graph II.1.8: Factor "technological change" - percentage balance (42 |
 |
 |
Footnotes
(35) The ad-hoc questions were optional for national partner institutes in the harmonised business and consumer surveys, and they could choose to include them in either the February or March survey, with the overall survey period running from early February to 21 March.
(36) See McKinsey & Company (2021) "Taking the pulse of shifting supply chains"; OECD (2024) "Promoting resilience and preparedness in supply chains; European Central Bank (ECB) Economic Bulletin, Issue 8, 2023; and International Monetary Fund (IMF) – World Economic Outlook, April 2023.
(37) The SUCH supply chain survey carried out by the European Investment Bank in cooperation with the European Commission (DG GROW) in 2023 singles out Investment in digital inventory and inputs tracking, which allow firms to track goods through the supply chain and delivery to their premises.
(38) Graph II.2.3 for question 3 excludes data for Italy. The response shares for question 3 and question 4 would otherwise not be directly comparable, as question 4 was optional to reduce the survey burden in some countries participating to the ad hoc survey. As such, question 4 was not asked in Italy, a sufficiently large country to make a difference when aggregating the results and drawing conclusions.
(39) In this box, EU aggregates are calculated as population-weighted averages of the results for the 13 countries that carried out the ad-hoc question, namely Austria, Bulgaria, Cyprus, the Czech Republic, Germany, Finland, Croatia, Hungary, Italy, Latvia, Malta, Poland and Slovakia. In terms of population, these countries represent around 52% of the EU-wide aggregate.
(40) More detailed results are available in European Business Cycle Indicators: The impact of selected factors on consumers' views of the economy. 1st Quarter 2025.
(41) In Germany, the ad hoc question was asked before Parliament approval of the plans for a significant spending surge on infrastructure and defence.
(42) The percentage balance represents the difference between the percentage of respondents who believe a factor has a positive impact on their country's economy and the percentage who believe it has a negative impact.